
| Page: |
| Home > Help Needed / General Tech Chat > The boost against CR graph | |||||||
 736 Posts Member #: 1865 Post Whore Norwich, Norfolk |
21st May, 2012 at 10:37:49am
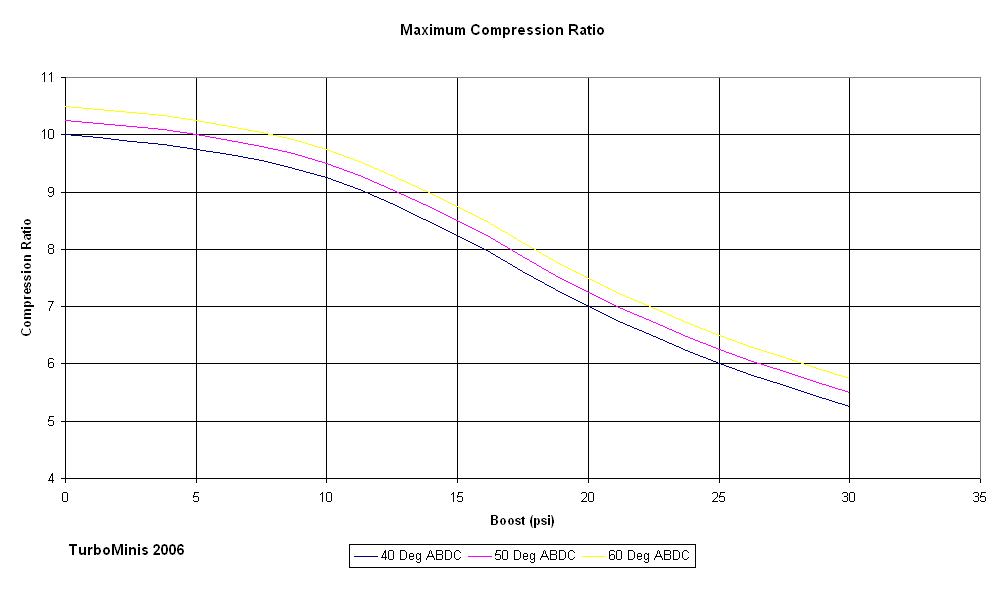
This graph has made a few appearances on the forum:
|
||||||
 10023 Posts Member #: 1456 Mongo Barnsley, South Flatcapshire |
21st May, 2012 at 10:48:03am
Put it this way we ran 25psi on 8.15:1 that graph seems to sat a max of 16-18psi.
If something is worth doing, it's worth doing half of. |
||||||
|
8604 Posts Member #: 573 Formerly Axel Podland |
21st May, 2012 at 10:50:04am
That graph was very conservative when I produced it in the first place.
Edited by Paul S on 21st May, 2012. Saul Bellow - "A great deal of intelligence can be invested in ignorance when the need for illusion is deep."
|
||||||
|
3006 Posts Member #: 2500 Post Whore Buckinghamshire |
21st May, 2012 at 12:03:35pm
This will encourage me to push my car to 18psi this year ! |
||||||
|
10023 Posts Member #: 1456 Mongo Barnsley, South Flatcapshire |
21st May, 2012 at 12:27:00pm
You are a mad man Dave If something is worth doing, it's worth doing half of. |
||||||
| Home > Help Needed / General Tech Chat > The boost against CR graph | |||||||
|
|||||||

| Page: |